Particle properties#
The particle table defines the names, PDG IDs, masses, widths and lifetimes that EvtGen uses. A Generator gives access to it.
Creating a Generator reads the decay and particle tables and initializes Pythia8, which prints a lot of log output. That output is hidden on this page.
Generator.properties() looks up a particle by EvtGen name or PDG ID and returns its ParticleProperties:
generator.properties("J/psi")
ParticleProperties(name='J/psi', pdg_id=443, mass=3.096900)
properties = generator.properties(443)
properties.mass, properties.width, properties.spin2
(3.0969, 9.29e-05, 2)
Spins are stored as twice the spin, spin2, so that they are integers. Masses and widths are in GeV and ctau in mm. The mass range from min_mass to max_mass limits the mass that EvtGen samples for a resonance.
The full table#
Generator.particles() returns all entries, which is convenient to search the table:
table = pd.DataFrame([
    {
        "name": p.name,
        "PDG ID": p.pdg_id,
        "mass": p.mass,
        "width": p.width,
        "ctau": p.ctau,
        "charge": p.charge,
        "spin2": p.spin2,
    }
    for p in generator.particles()
])
len(table)
549
| name | PDG ID | mass | width | ctau | charge | spin2 | |
|---|---|---|---|---|---|---|---|
| 40 | D_s2*- | -435 | 2.56910 | 0.016900 | 0.000000 | -1.0 | 4 |
| 84 | D_s- | -431 | 1.96834 | 0.000000 | 0.149896 | -1.0 | 0 |
| 105 | D_s0*- | -10431 | 2.31780 | 0.001000 | 0.000000 | -1.0 | 0 |
| 109 | D_s0*+ | 10431 | 2.31780 | 0.001000 | 0.000000 | 1.0 | 0 |
| 117 | D_s*+ | 433 | 2.11220 | 0.000007 | 0.000000 | 1.0 | 2 |
| 163 | D_s1- | -20433 | 2.45950 | 0.001000 | 0.000000 | -1.0 | 2 |
| 167 | D_s2*+ | 435 | 2.56910 | 0.016900 | 0.000000 | 1.0 | 4 |
| 175 | D_s1+ | 20433 | 2.45950 | 0.001000 | 0.000000 | 1.0 | 2 |
| 244 | D_s+ | 431 | 1.96834 | 0.000000 | 0.149896 | 1.0 | 0 |
| 423 | D_s*- | -433 | 2.11220 | 0.000007 | 0.000000 | -1.0 | 2 |
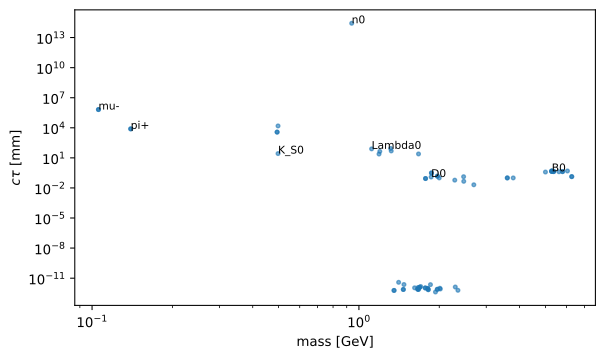
The table spans many orders of magnitude in lifetime. Long-lived particles leave visible tracks or decay vertices in a detector, while resonances decay immediately and are characterized by their width \(\Gamma = \hbar c / c\tau\):
Unknown particles raise a KeyError:
try:
    generator.properties("D_x+")
except KeyError as error:
    print(error)
"Unknown particle name 'D_x+'"